The Command Center is a mission-control view embedded inside your ATS — the single screen where you run your digital workers. KPI summary, action queue, the status of every worker, ROI telemetry. Each worker plans, waits for a human signature, and executes — with every gateway action reversible for 7 days. It's bundled into every digital-worker subscription, not a separate product.
Embedded in Your ATS · Live in 2–3 weeks · Real data, human-in-the-loop
Section 1 · The Dashboard
One screen for the entire middle office.
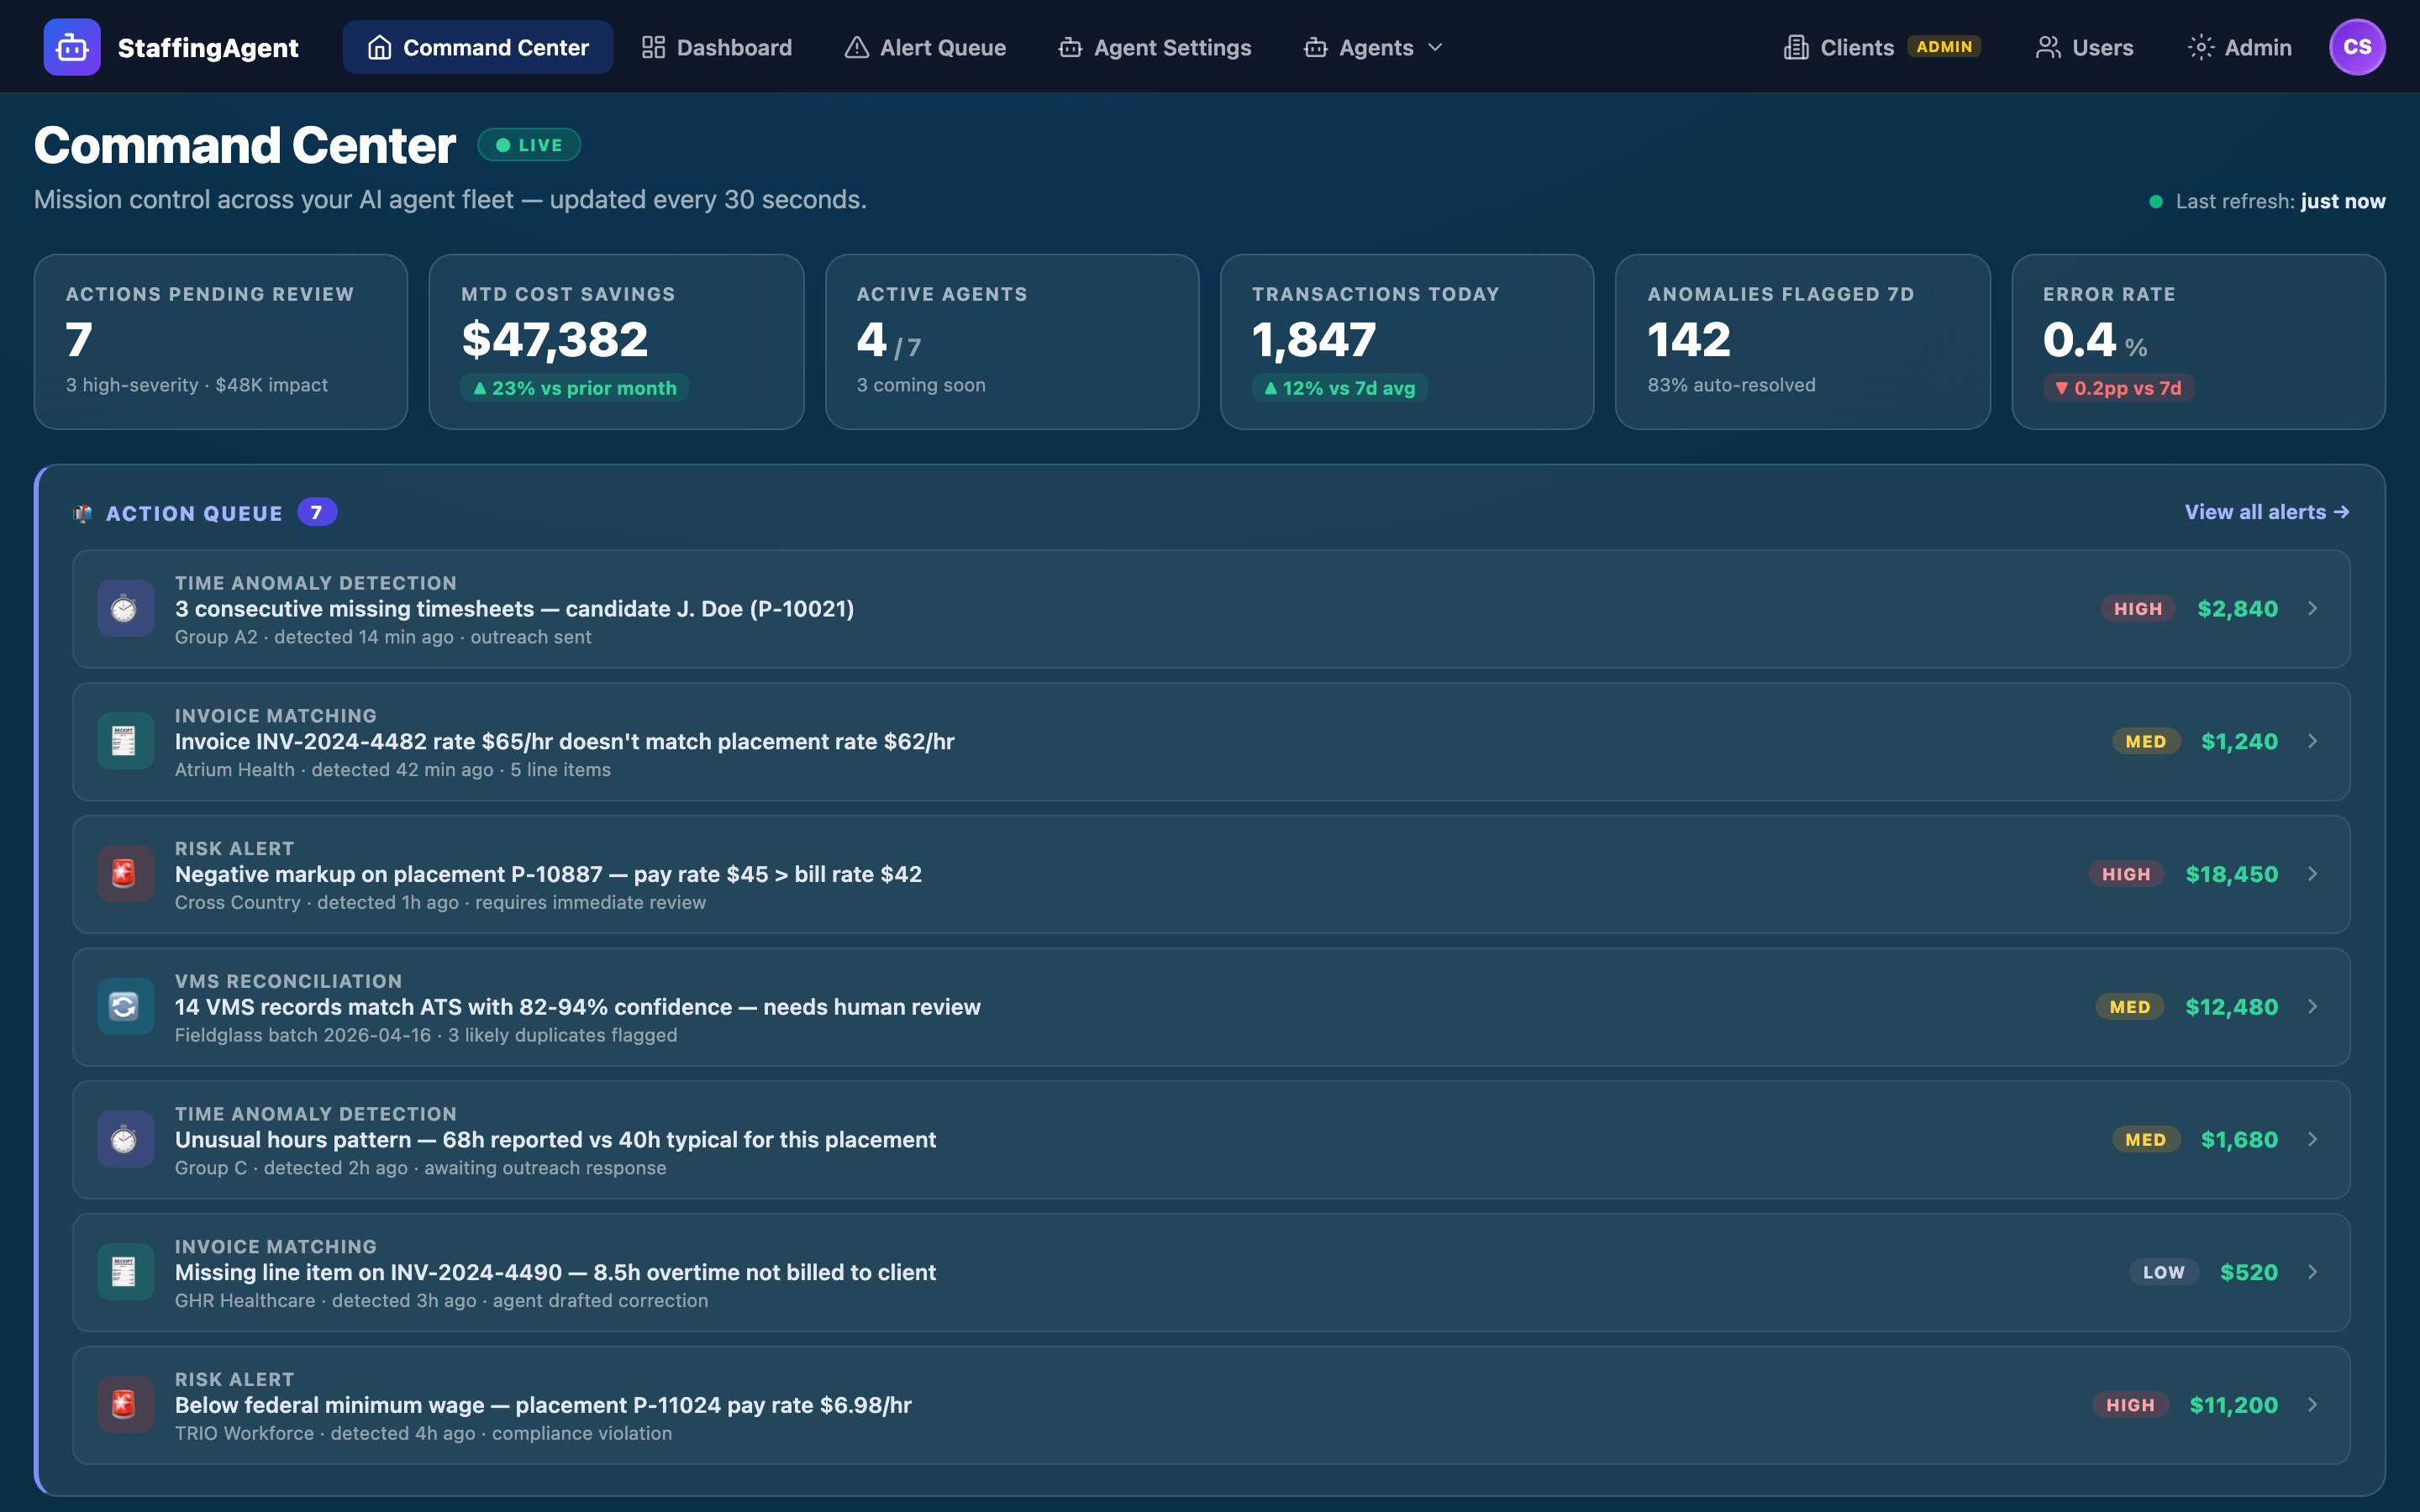
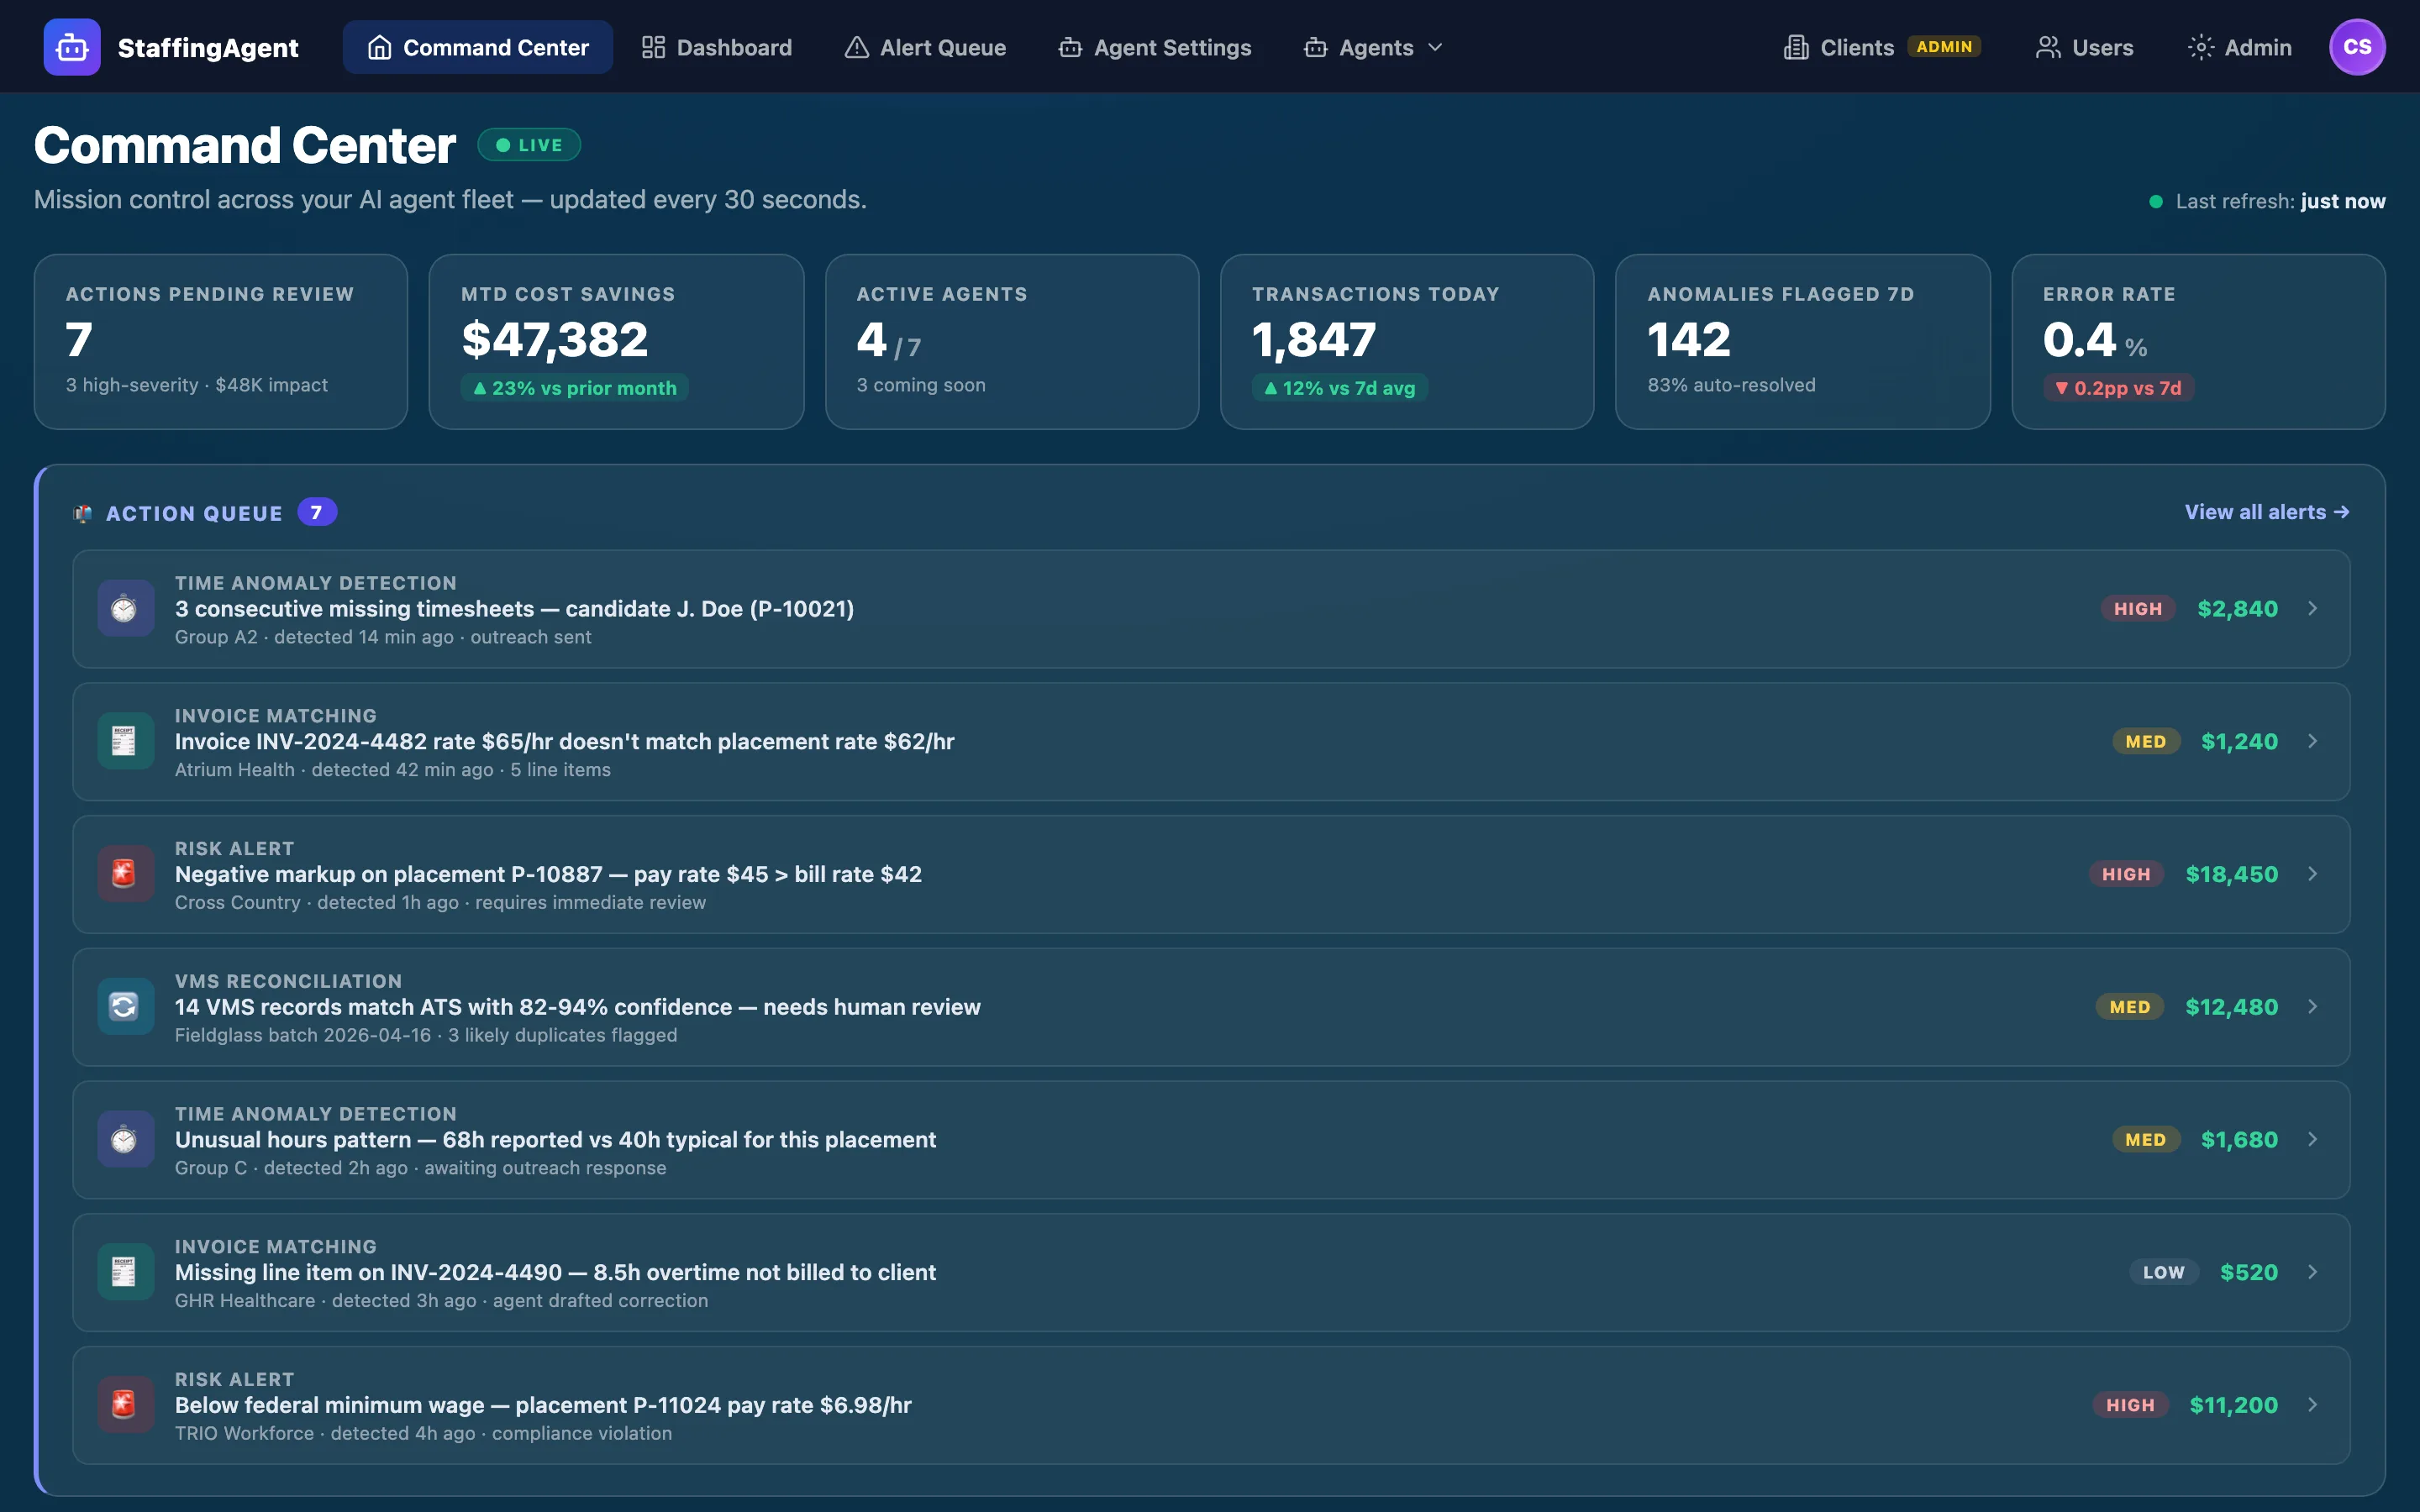
The dashboard landing view is the center of gravity for everything StaffingAgent does. It surfaces the six numbers an operations leader actually needs, the prioritized action queue of alerts across every agent, the live Agent Fleet panel with status and throughput, and a running ROI ledger. Refreshed every 30 seconds. Drill-through to the underlying ATS record in a single click.
Action Queue — prioritized alerts across Time Anomaly, PayBill Risk Agent, and VMS Reconciliation with severity and dollar impact
Agent Fleet panel — status, daily transactions, and accuracy or match-rate for every agent; one-click "Run Agent" launches the Plan → Approve → Execute pipeline
ROI telemetry — cost savings captured vs. prior period, with drill-through to the decisions that produced them
Seven digital workers. Three shipping today. Four on the 2026 roadmap.
Each digital worker has a narrow job, a typed set of tools it's allowed to call, and a Plan → Approve → Execute pipeline. No worker touches production data without a human signature. Every worker runs in dry-run mode before it's rolled out in anger.
Every agent action is planned, reviewed, and executed — in that order.
When you click "Run Agent" in the Command Center, the agent doesn't start taking actions. It builds a plan — loads tenant context and configuration, scans your ATS for the pattern it owns, classifies findings into action groups, and drafts recommended actions. Then it shows you the full plan and waits.
You uncheck anything that shouldn't run, click Approve & Execute, and the agent invokes its typed tools against the gateway, one action at a time. Every execution writes to the audit log with timestamp, actor, tenant, and outcome.
AgentPlanView — plan_ready phase with 5 proposed actions, checkboxes, and summary stats.
Phase 3 · Plan ready — summary stats + per-action checkboxes shown; awaits human approval
Phase 4 · Executing — approved actions invoked through the typed gateway, one at a time, with progress
Phase 5 · Complete — results written to the audit log, surfaced in the Alert Queue, and tallied in ROI telemetry
Dry-run toggle on every agent: run the full pipeline end-to-end against real data, generate the plan, don't actually call the gateway tools. Used for safe rollouts on new tenants.
Section 4 · Alert Queue & Reversibility
Every decision lands in the Alert Queue. Every gateway action is reversible for 7 days.
When an agent executes an action — sending a reminder, marking a timesheet DNW, releasing an invoice within tolerance, updating a placement — the result lands in the Alert Queue with full context: candidate, client, pay period, why the alert fired, the complete event timeline, and the resolve footer.
If something was approved in error, you can reverse any gateway action inside the 7-day window without touching the database. The reversal runs through the same typed gateway as the original action and writes a matching entry to the audit log.
Alert Queue resolve drawer — full context, timeline, and resolution footer.
Full context per alert — candidate, client, pay period, why it fired, full event timeline
Audit trail retained indefinitely — the 7-day window is only on reversal; the log is permanent
State filters — All / Detected / Reminder Sent / HITL Required / Resolved
Severity filter & KPI header — Alerts Triggered, Auto-Resolved, HITL Required, Currently Open, Avg Time to Resolve
Section 5 · Agent Settings
Per-tenant thresholds, templates, and runtime — with platform defaults you can reset to.
Every agent is configurable per tenant without code. The Agent Settings view exposes thresholds (e.g. escalate to HITL after 2 consecutive missed timesheets), message templates for SMS and email outreach (Subject: Missed timesheet reminder — {placement_id}), runtime controls (schedule, dry-run toggle, concurrency), and integrations (SMS provider, email sender, audit log sink).
Changes are diffed against platform defaults: you can see exactly what your tenant overrides and reset any field to the default in one click. A sticky save bar tracks dirty changes and offers a discard path.
Thresholds tab — all detector cutoffs (hours variance, rate drift, missed-cycle count) in one place
Message Templates tab — per-template editing with variable reference and preview
Command Center embedded in your ATS. Risk tolerances, placement statuses, and role-based access configured together in a 30–60 minute session.
Day 2
3
Agents dry-run & team trained
Every active agent runs end-to-end in dry-run on your real data. Team walk-through of Plan → Approve → Execute + Alert Queue. First live agent run on day 3.
Day 2–3
Pricing
The control plane is included with every digital worker.
You don't buy the Command Center separately — it comes bundled with every digital worker you hire. Workers are priced per role, as an annual subscription invoiced monthly, always below the fully-loaded cost of the hire they offset. Start with one worker, run it from here, and add more as the ROI proves out.
Your digital workers detect the issues, reconcile the records, and draft the outreach — you approve every commitment from the Command Center, and reverse any gateway action for 7 days.